
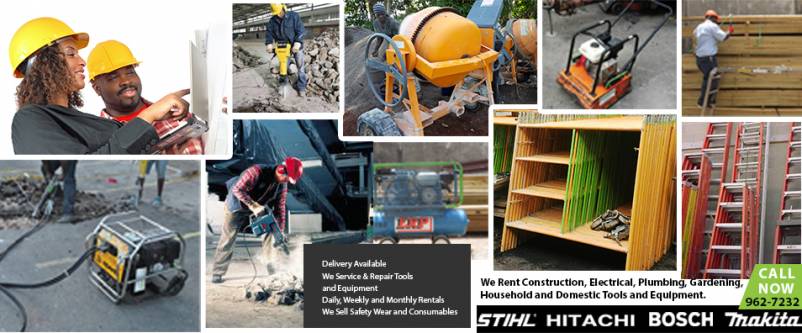

Rymac Rentals Co. Ltd. has stocked up a wide variety of equipment, including power tools, cleaning/gardening equipment, mixers (concrete), welding machines, generators, pumps, metal props, scaffolding & ply boards just to name a few. We also service & repair tools and equipment’s.
We also do delivery, or you can pick up. Equipment rental rates for jobs. Read More
-
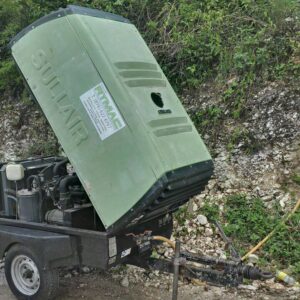 Air Compressor – Site Towable$22,000.00 – $40,000.00
 -
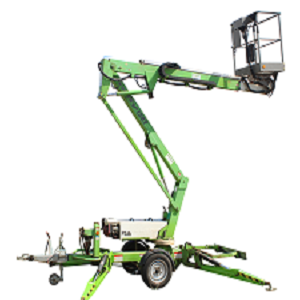 Telescopic Manlift (35ft)$18,000.00 / day
 -
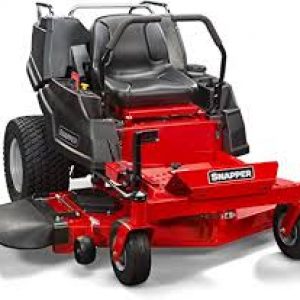 Ride On Lawn Mower (48 inch)$13,000.00 / day
 -
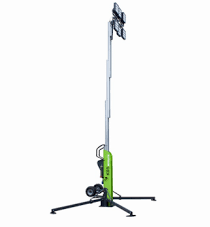 Tower Light 110v (Powered)$12,000.00 / day
 -
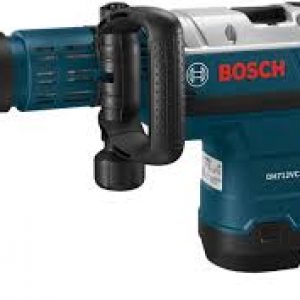 Demolition Hammer / Jackhammer / Breaker$3,000.00 – $10,000.00
 -
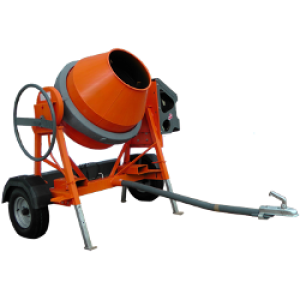 Concrete Mixer$1,500.00 – $7,000.00
 -
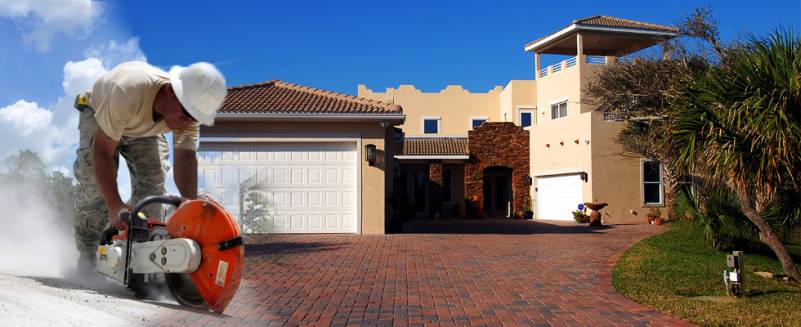
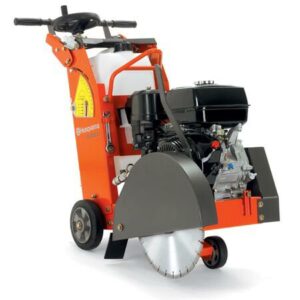 Concrete Floor Saw – Gas$6,500.00 – $7,000.00
 -
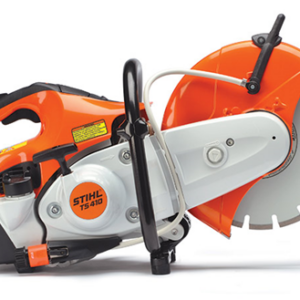 Disc Cutter 12 inch -2 Stroke Gas$6,800.00 / day
 -
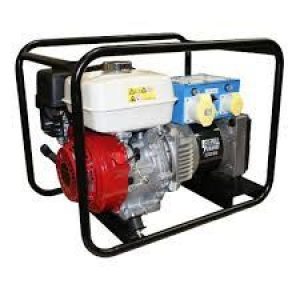 Power Generator$4,200.00 – $5,700.00
 -
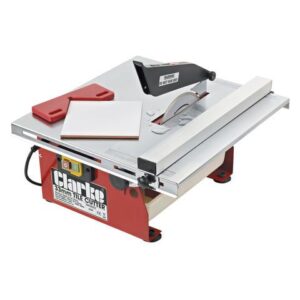 9 inch Tile Cutter$5,500.00 / day
 -
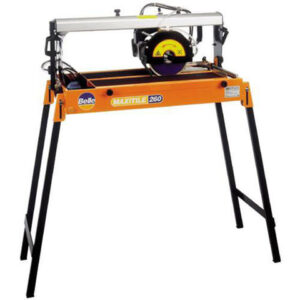 9 inch Overhead Tile Cutter- 110V$5,500.00 / day
 -
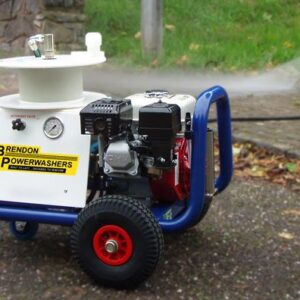 Pressure Washer 3200psi- Gas$4,200.00 / day